Candle Sticks
This pattern appears in a downtrend and warns that the trend will change. It consists of a black candlestick and a Doji with a downward gap at the opening. When the Doji is in the form of an Umbrella the pattern is called

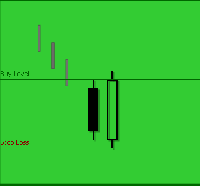
This pattern is characterized by a large white body engulfing a preceding smaller black body which appears during a downtrend. The white body does not necessarily engulf the shadows of the black body but totally engulfs the body itself. This is an important bottom reversal signal.
Recognition Criteria
1. The market is characterized by a prevailing downtrend.
2. A black body is observed on the first day.
3. The white body that is formed on the second day completely engulfs the black body of the preceding day.
Pattern Requirements and Flexibility
The length of the first black candlestick in Bullish Engulfing is not important. It can even be a Doji. However the second one has to be a normal or long white candlestick. Either the body tops or the body bottoms of the two candlesticks may be at the same level but in any case the white body should be longer than the previous black body.
Trader

This pattern consists of a black body and a small white body that is completely inside the range of the black body. If an outline is drawn for the pattern it looks like a pregnant woman. This is not a coincidence.

This is a major bullish reversal pattern which is even more significant than a regular Bullish Harami. The outline again looks like a pregnant woman as with the Bullish Harami Pattern. However now the baby is a Doji. Basically the pattern is characterized by a black body followed by a Doji that is completely inside the range of the prior black body.
Recognition Criteria
1. The market is characterized by a prevailing downtrend.
2. A black body is observed on the first day.
3. The Doji that is formed on the second day is completely engulfed by the body of the first day.
Pattern Requirements and Flexibility
The Bullish Harami Cross consists of two candlesticks in which the body of the first black candlestick engulfs the body of the following Doji. The body of the first candlestick may be short.
Trader

This pattern consists firstly of a black Marubozu and then a white Marubozu. After the black Marubozu the market opens above the prior session

This pattern occurs during a downtrend. The first day
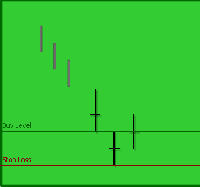
This pattern is a sequence of three Doji. The occurrence of this pattern is extremely rare so when it occurs it should not be ignored.
Recognition Criteria
1. The market is characterized by a prevailing downtrend.
2. Three consecutive Doji are seen. 3. The second day gaps below the first and the third.
Pattern Requirements and Flexibility
The Bullish Three Star consists of three consecutive Doji in which the second Doji gaps below the other two Doji. It is sufficient that the gap is a body gap. There is no need for a gap between shadows.
Trader?s Behavior
Bullish Tri Star requires that we have a market which was in a downtrend for a long time. However the weakening trend is probably indicated by the bodies that are becoming smaller. The first doji is a matter of concern. The second Doji clearly indicates that market is losing its direction. Finally the third doji warns that the downtrend is over. This pattern indicates too much indecision leading to the reversal of positions.
Buy/Stop Loss Levels
The confirmation level is defined as the last close. Prices should cross above this level for confirmation. The stop loss level is defined as the lower of the last two lows. Following the BUY if prices go down instead of going up and close or make two consecutive daily lows below the stop loss level while no bearish pattern is detected then the stop loss is triggered.

This pattern is a sequence of three Doji. The occurrence of this pattern is extremely rare so when it occurs it should not be ignored.
Recognition Criteria
1. The market is characterized by a prevailing downtrend.
2. Three consecutive Doji are seen.
3. The second day gaps below the first and the third.
Pattern Requirements and Flexibility
The Bullish Three Star consists of three consecutive Doji in which the second Doji gaps below the other two Doji. It is sufficient that the gap is a body gap. There is no need for a gap between shadows.
Trader
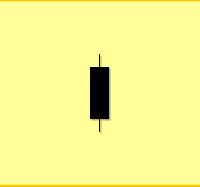
This candlestick implies normal selling pressure and shows that prices declined during the day from open to close and the sellers were in control.
Recognition Criteria
1. The body of the candlestick is black with normal length.
Candlestick Requirements and Flexibility
The black body of the candlestick should be of average length. The shadows? length is not important.
Trader's Behavior
This candlestick alone is not reliable enough to decide about bearishness since it reflects only one day's trading that was under sellers control. It may show the continuation of a trend as well as the reversal. Other neighboring candlesticks must be taken into consideration for a decision regarding market direction.

This candlestick implies normal selling pressure and shows that prices declined during the day from open to close and the sellers were in control.
Recognition Criteria
1. The body of the candlestick is black with normal length.
Candlestick Requirements and Flexibility
The black body of the candlestick should be of average length. The shadows length is not important.
Trader's Behavior
This candlestick alone is not reliable enough to decide about bearishness since it reflects only one day's trading that was under sellers control. It may show the continuation of a trend as well as the reversal. Other neighboring candlesticks must be taken into consideration for a decision regarding market direction.